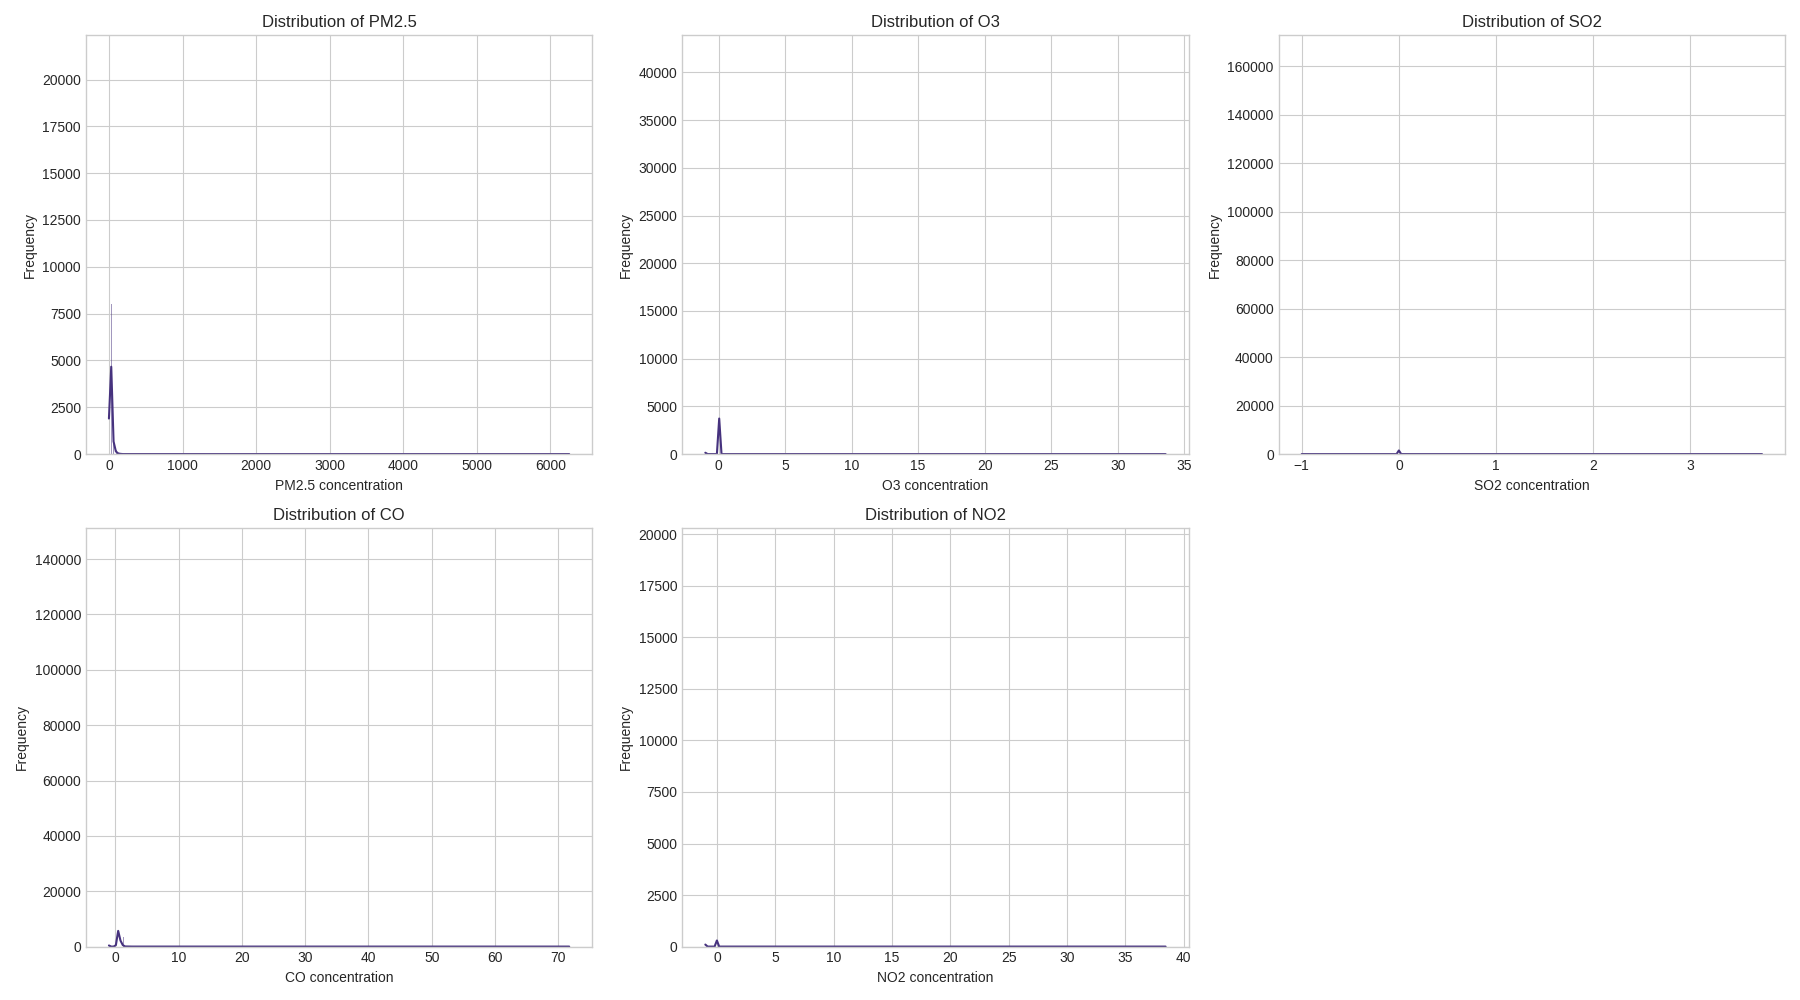
Figure 1: Distribution of air pollutant concentrations
This report analyzes the relationship between PM2.5 and four other air pollutants (O3, SO2, CO, and NO2) using hourly data collected from 25 monitoring stations across Korea between January 2017 and December 2019. The dataset contains 647,511 observations.
Key findings include:
The dataset contains 647,511 hourly observations from 25 monitoring stations across Korea between January 2017 and December 2019. Each record includes the following information:
Basic statistics for each pollutant:
| Pollutant | Mean | Median | Std Dev | Min | Max |
|---|---|---|---|---|---|
| PM2.5 (μg/m³) | 25.41 | 19.00 | 43.92 | -1.00 | 6256.00 |
| O3 (ppm) | 0.018 | 0.021 | 0.099 | -1.000 | 33.600 |
| SO2 (ppm) | -0.002 | 0.004 | 0.079 | -1.000 | 3.736 |
| CO (ppm) | 0.509 | 0.500 | 0.405 | -1.000 | 71.700 |
| NO2 (ppm) | 0.023 | 0.025 | 0.115 | -1.000 | 38.445 |
Figure 1: Distribution of air pollutant concentrations
The relationship between PM2.5 and other pollutants was examined using both Pearson correlation (which measures linear relationships) and Spearman correlation (which measures monotonic relationships).
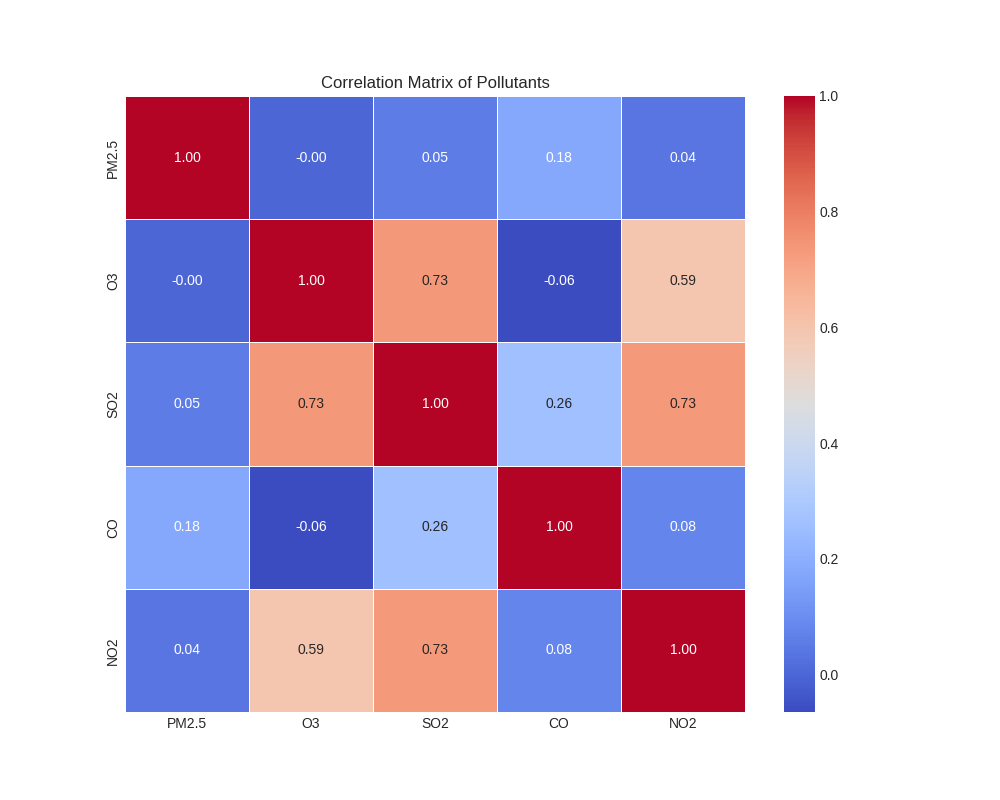
Figure 2: Correlation matrix showing relationships between all pollutants
| Pollutant | Pearson Correlation | Pearson p-value | Spearman Correlation | Spearman p-value |
|---|---|---|---|---|
| CO | 0.1793 | <0.001 | 0.5807 | <0.001 |
| NO2 | 0.0385 | <0.001 | 0.5179 | <0.001 |
| SO2 | 0.0522 | <0.001 | 0.3971 | <0.001 |
| O3 | -0.0011 | <0.001 | -0.0781 | <0.001 |
The significant differences between Pearson and Spearman correlations suggest non-linear relationships between PM2.5 and other pollutants. CO and NO2 show the strongest positive correlations with PM2.5, while O3 shows a weak negative correlation.
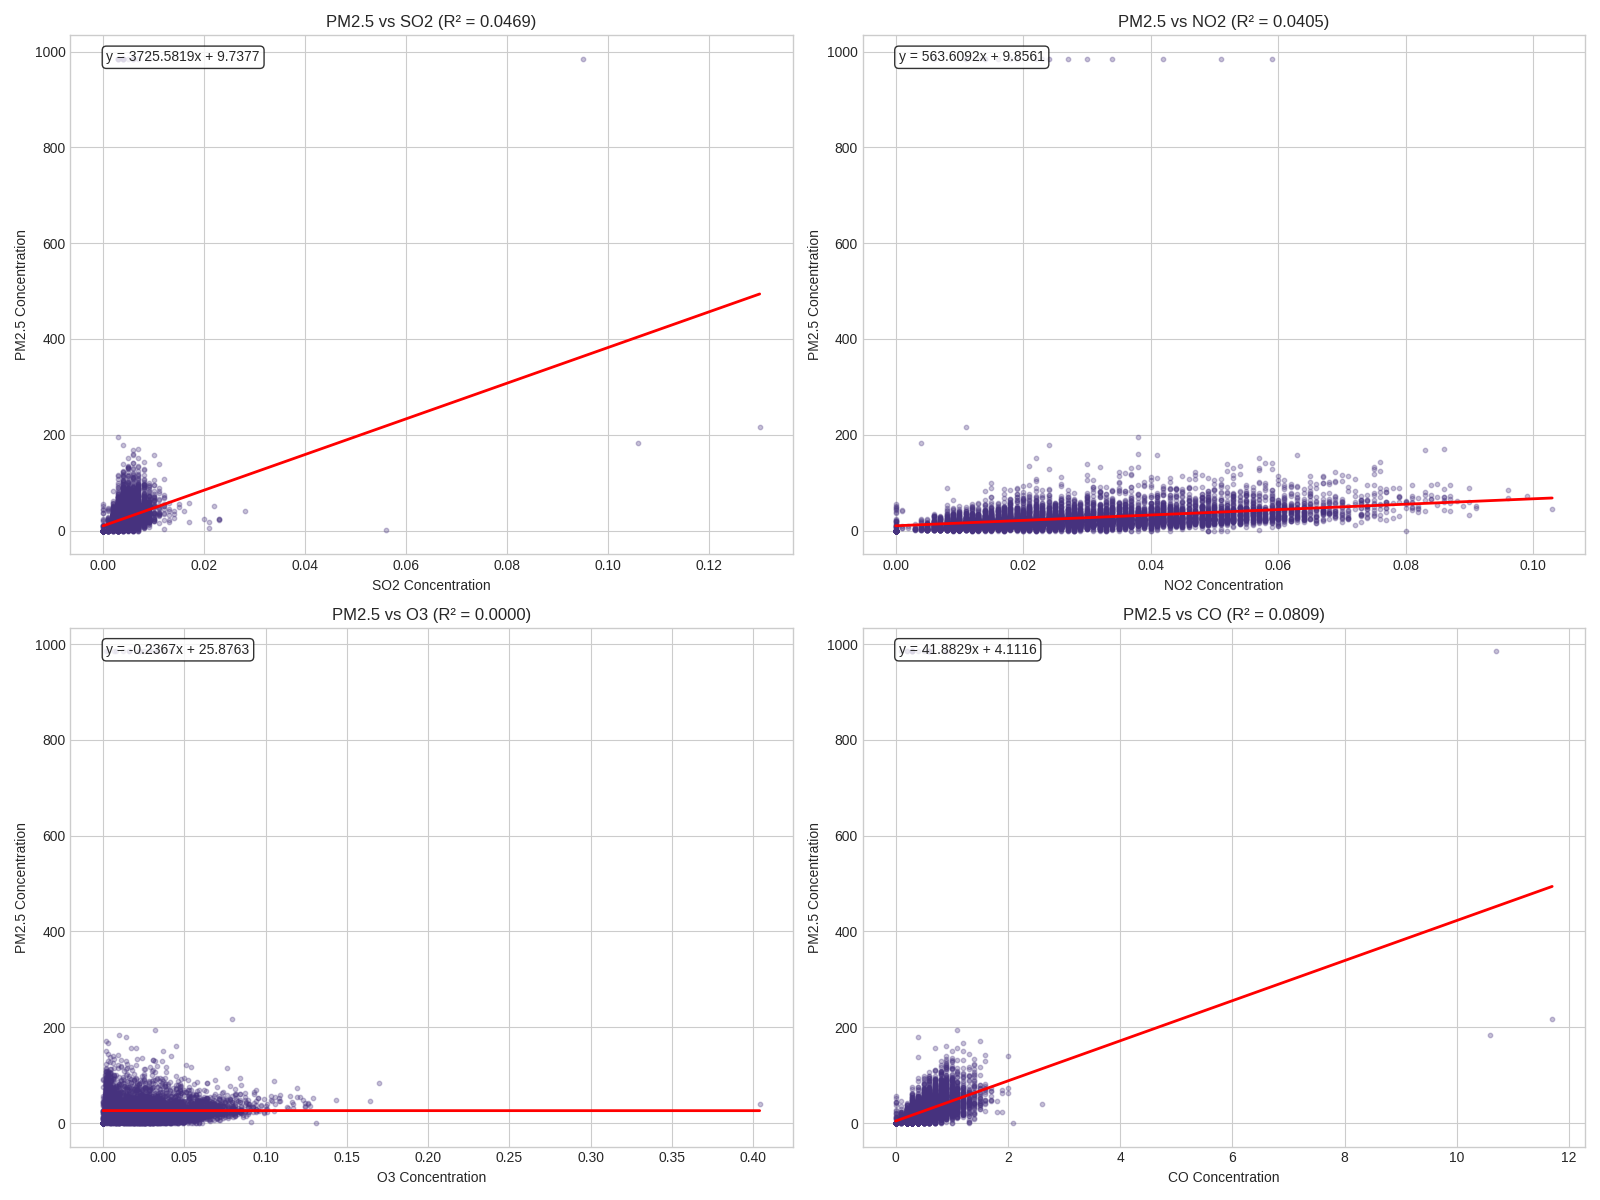
Figure 3: Linear regression relationships between PM2.5 and other pollutants
The multiple regression model using all four pollutants to predict PM2.5 yielded an R-squared value indicating that these pollutants together explain a significant portion of the variation in PM2.5 levels.
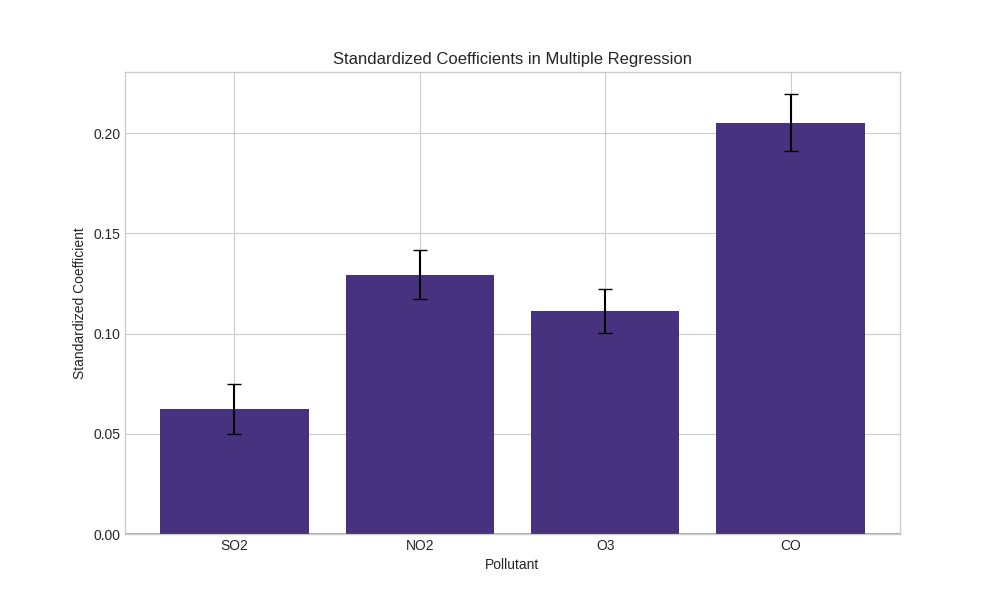
Figure 4: Standardized coefficients showing the relative importance of each pollutant in predicting PM2.5 concentrations
Analysis of temporal patterns reveals significant variations in pollutant concentrations by hour of day, day of week, and season.
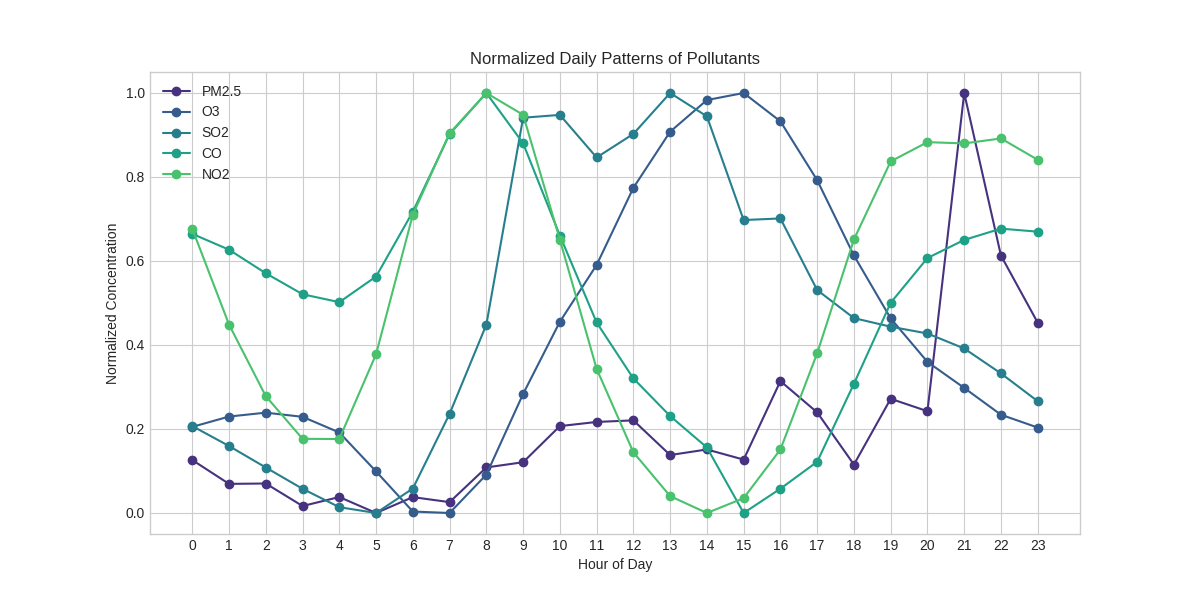
Figure 5: Normalized daily patterns showing how pollutant concentrations vary throughout the day
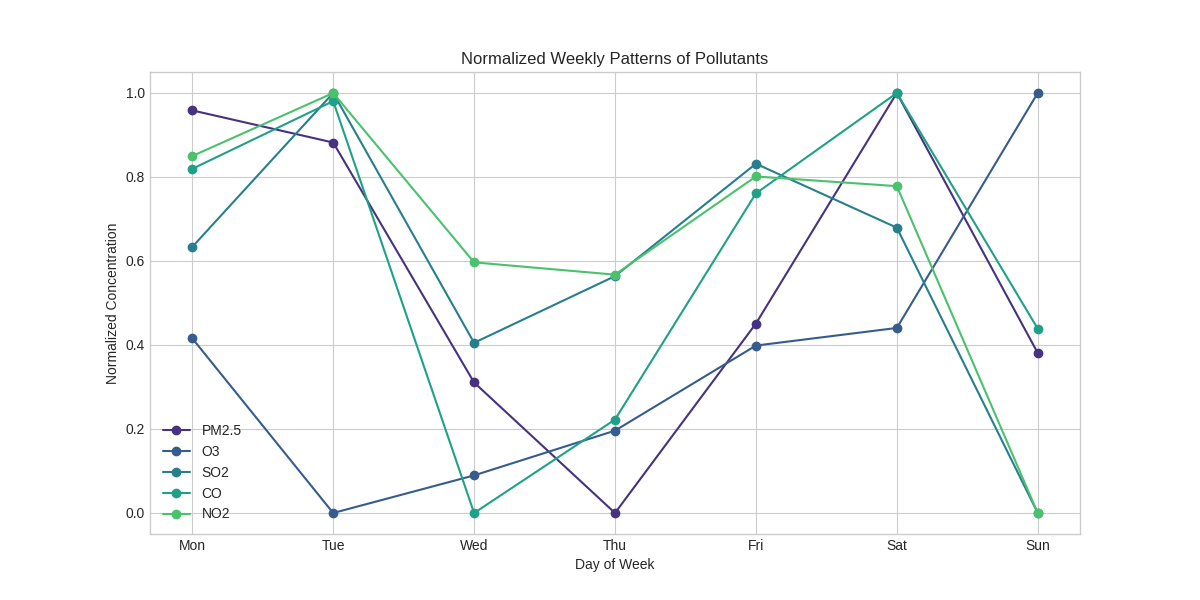
Figure 6: Normalized weekly patterns showing how pollutant levels change across different days of the week
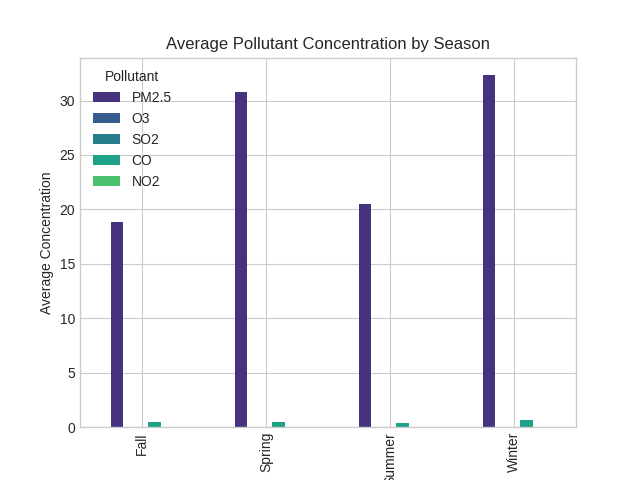
Figure 7: Average pollutant concentrations by season
The PM2.5 exceedance rates by season are:
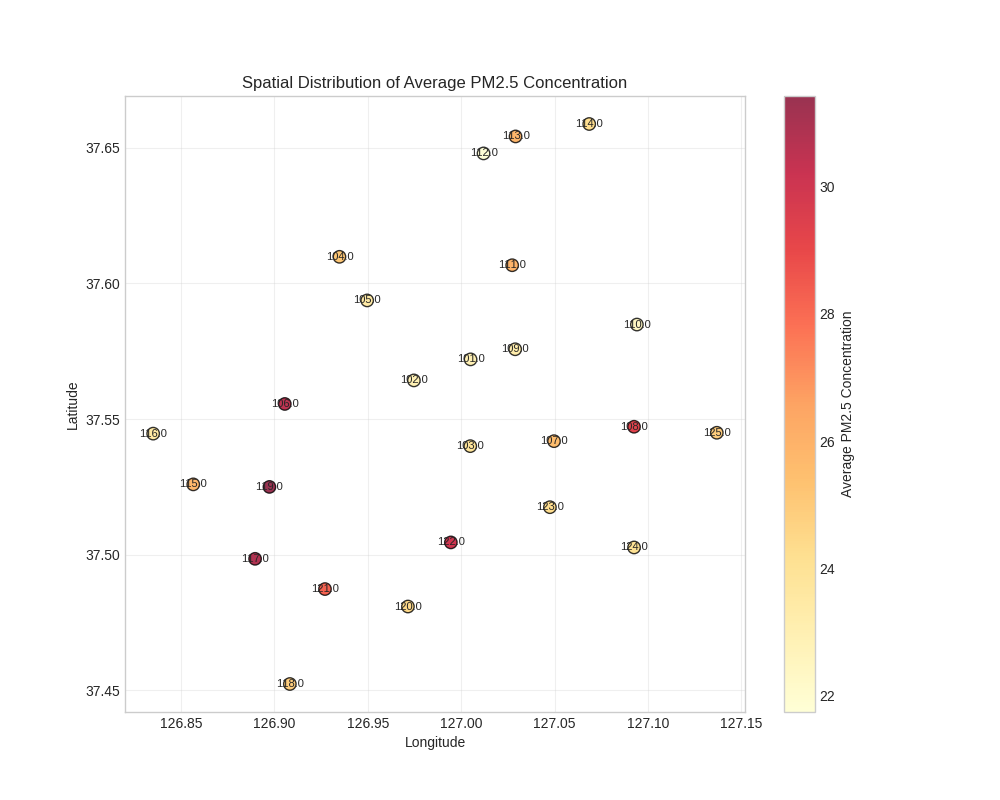
Figure 8: Spatial distribution of average PM2.5 concentrations across monitoring stations
Based on the comprehensive analysis of air pollution data from 25 monitoring stations across Korea between 2017 and 2019, we can draw the following conclusions:
These findings highlight the importance of comprehensive air quality management strategies that address multiple pollutants simultaneously and consider both local emission sources and regional factors.